Observing ShareShield with Signoz
Learning new things is tough, but running blind is tougher
I've been running ShareShield for a few years now, and I've never known what's really going on at any given moment.
Now that I've gotten the hard part out of the way and admitted ignorance, I can show you how I went from blind developer to omnipotent admin.
Historically I've only ever cared if something is online or offline like a lot of small shop sysadmins. But these days observability is all the rage.
Afraid as I am of ingesting 20k logs a minute and being unable to effectively parse them all, the value add that I'm imagining is worth the pain of configuring.
ShareShield has a few components:
- Cloudflare pages frontend
- Azure App Service API backend
- Azure SQL database
- Azure tables storage
Those are the big pieces anyway, and right now if there was a recurring error on the API, or if SQL queries were timing out I'd have no idea.
I don't even know how responsive any of the core components are, so how can I make smart decisions? I cannot.
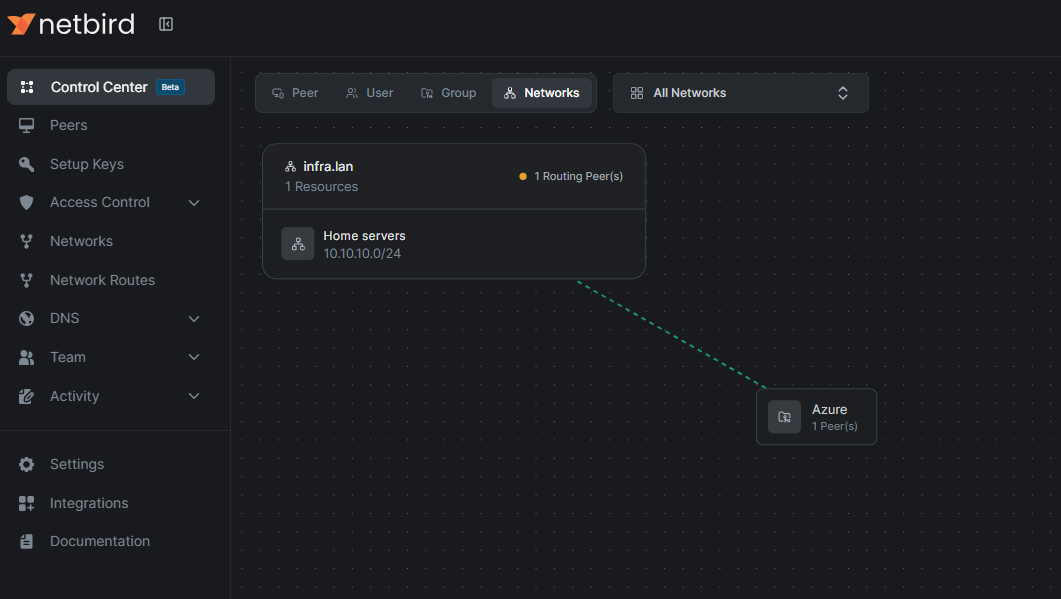
Luckily, I have a Signoz instance in my homelab, so thanks to the power of Netbird I'm going to create a path to bring logs, metrics, and traces from Azure to my living room
I'll finally know what's going on, and save the embarrassment of someone messaging me to tell me ShareShield isn't working.
Platform monitoring
What is platform monitoring? That's the data coming from the Azure infrastructure, it's good to get data from my web apps but it's only half the picture. Azure sends health metrics and logs via an Event hub to my VPS which is running an OpenTelemetry collector container.
I added the event hub as a diagnostic setting destination on the app service and Azure SQL resources, they're good at sending metrics but less good at sending logs that OpenTelemetry can parse
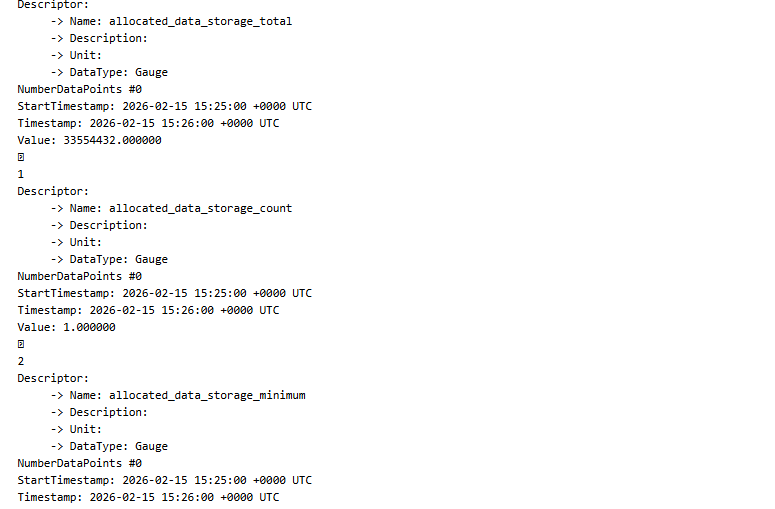
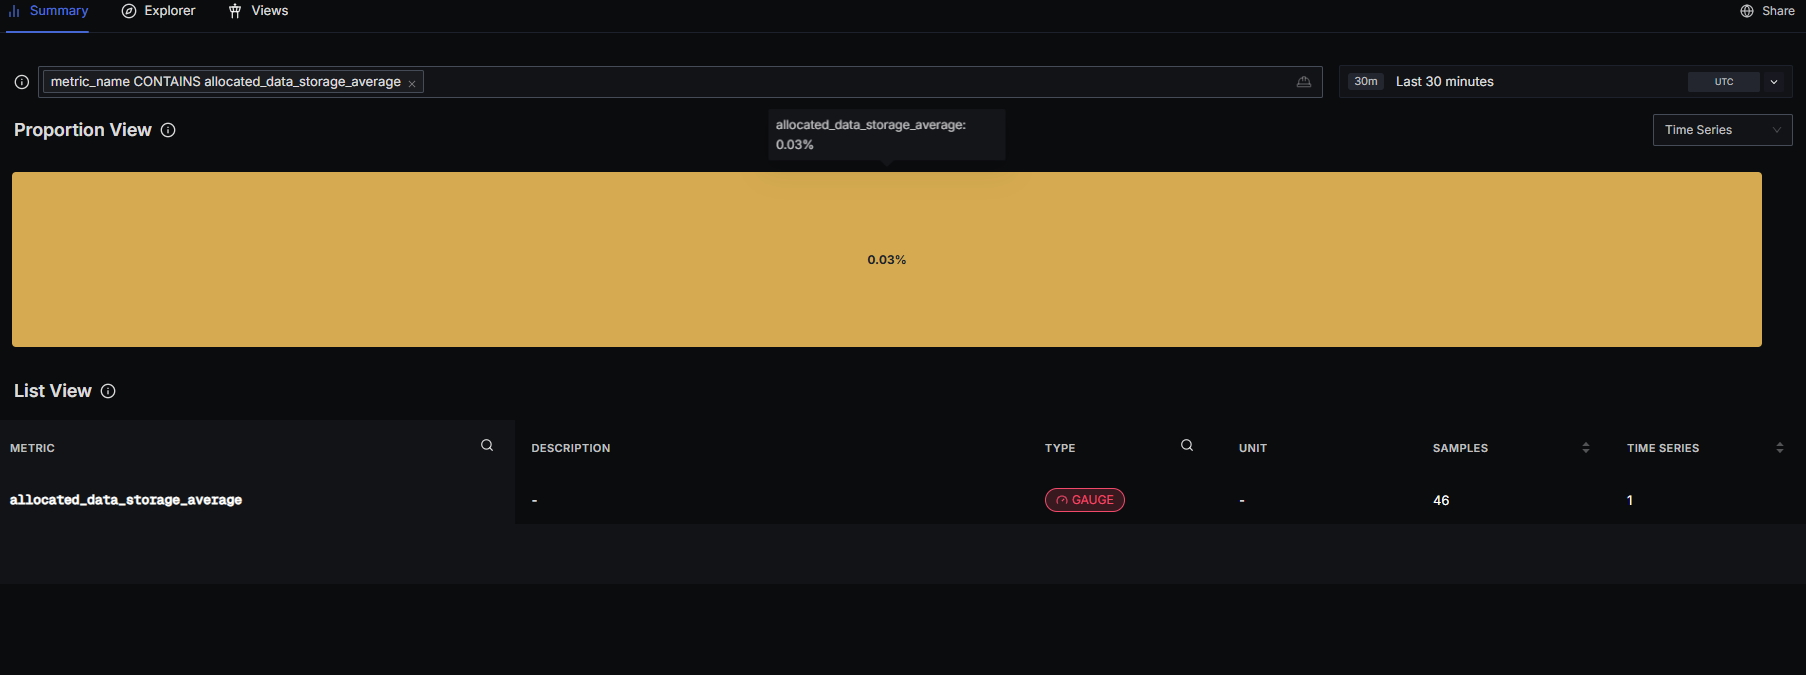
So I'm getting metrics through, I don't have any nice way of viewing them yet, I can see them in Signoz so we'll come back to them some other day
I couldn't get the collector to parse Azure event hub logs just yet unfortunately, so I'll have to revisit that another day also.
In the interest of keeping this project moving at a reasonable pace we're moving on to the next bit
App instrumentation
Platform metrics I'm sure will be very useful someday, but if I'm being honest the part I'm actually interested in is what my application sees.
We're focusing on the backend API for this post, the frontend will either get its own article or I'll do it quietly in the background.
So, how do you instrument an API? Luckily I'm using node.js with Express for this API so it's basically really simple.
You gotta install some OpenTelemetry packages from NPM and put together a basic instrumentation file. You can see in the below example that the backend API for ShareShield is called AuthMate
The OpenTelemetry modules also integrate really well with a number of logging libraries, I'm using Winston for logs in this project so I just need to add OpenTelemetry as a transport to my central logger and logs are automatically sent back to Signoz
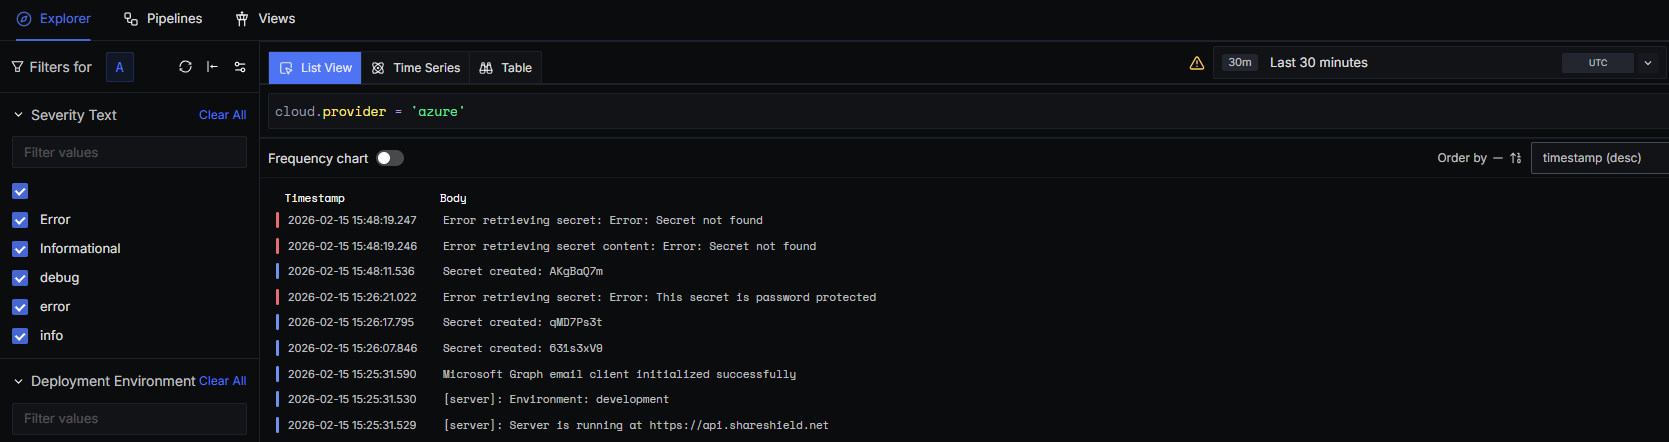
So now I can see the logs coming through which is kind of great since I no longer have to go to Azure App service, now they're actually searchable
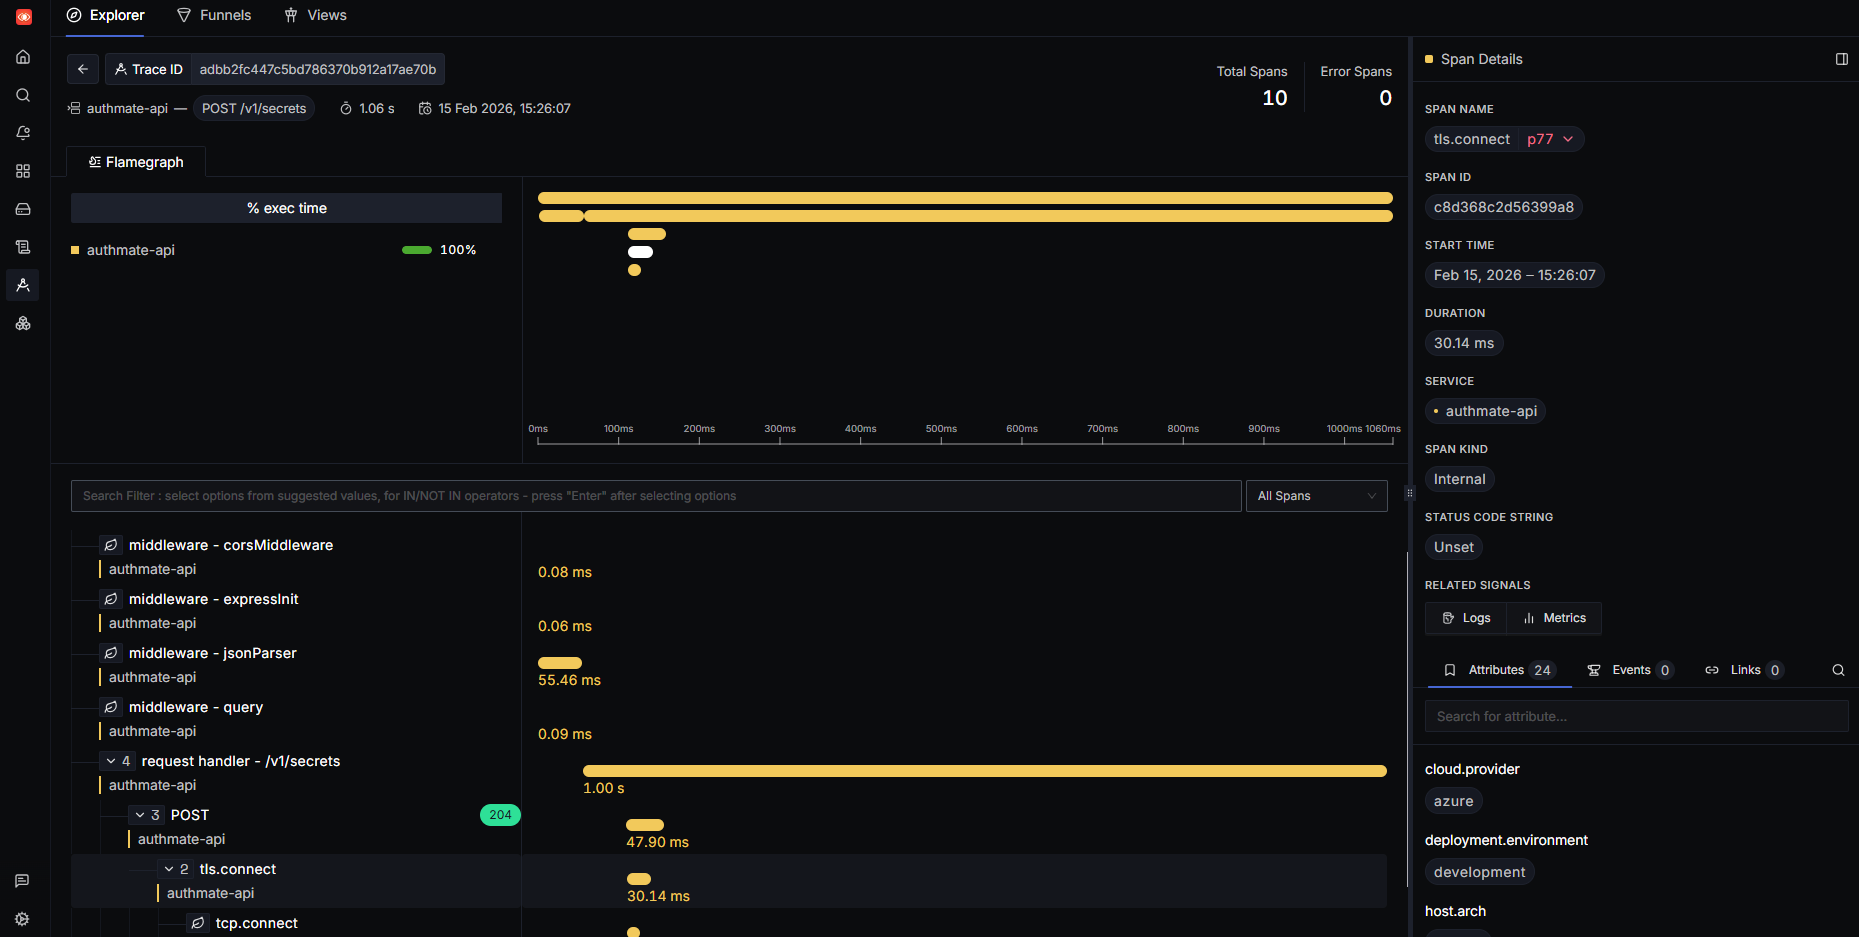
But the real star of the show in my opinion is the tracing. I can analyse request times, see how middleware or external services are affecting performance, see database wait times, and view related signals like metrics and logs in one place.
Conclusion
This is a very rough first attempt at instrumenting ShareShield, and there's a lot left that needs fine-tuning and adjusting.
But it does show how you can start collecting valuable data in not very much time with tools like OpenTelemetry.
Next I'm going to spend some time making dashboards and views, refining the collection process, and instrumenting the frontend too.
Considering this is new to me I'm going to give it an A for effort